 远程存储之VictoriaMetrics
因项目环境较多且需要监控展示,于是每个项目都要部署Grafana...而且这么多域名挺难记,新增项目也是如此重复性,emo中...,于是VictoriaMetrics (opens new window)来了,采集的监控数据汇总到同一数据源,那我只要一个Grafana不就行了??想想就开心
# 1. 安装VictoriaMetrics,官方建议是100w/s以下的数据点抓取,使用单节点版,单节点版可以省更多的CPU、内存、磁盘资源。
[root@manager prometheus]# cat vm.yaml
apiVersion: apps/v1
kind: Deployment
metadata:
  name: victoria-metrics
  namespace: kube-mon
spec:
  selector:
    matchLabels:
      app: victoria-metrics
  template:
    metadata:
      labels:
        app: victoria-metrics
      annotations:
        prometheus.io/scrape: "true"
        prometheus.io/port: "8428"
    spec:
      volumes:
        - name: storage
          persistentVolumeClaim:
            claimName: victoria-metrics-data
        - name: host-time
          hostPath:
            path: /etc/localtime
      containers:
        - name: vm
          image: registry.cn-hangzhou.aliyuncs.com/s-ops/victoria-metrics:v1.91.3
          imagePullPolicy: IfNotPresent
          args:
            - -storageDataPath=/var/lib/victoria-metrics-data # 数据持久化目录
            - -retentionPeriod=30d # 数据存储时间
            - -maxLabelsPerTimeseries=40 #标签限制数
          ports:
            - containerPort: 8428
              name: http
          volumeMounts:
            - mountPath: /var/lib/victoria-metrics-data
              name: storage
            - name: host-time
              mountPath: /etc/localtime
          resources:
            requests:
              cpu: "500m"
              memory: "1Gi"
            limits:
              cpu: "1000m"
              memory: "2Gi"
---
apiVersion: v1
kind: Service
metadata:
  name: victoria-metrics
  namespace: kube-mon
spec:
  type: NodePort
  ports:
    - port: 8428
  selector:
    app: victoria-metrics
1
2
3
4
5
6
7
8
9
10
11
12
13
14
15
16
17
18
19
20
21
22
23
24
25
26
27
28
29
30
31
32
33
34
35
36
37
38
39
40
41
42
43
44
45
46
47
48
49
50
51
52
53
54
55
56
57
58
59
60
2
3
4
5
6
7
8
9
10
11
12
13
14
15
16
17
18
19
20
21
22
23
24
25
26
27
28
29
30
31
32
33
34
35
36
37
38
39
40
41
42
43
44
45
46
47
48
49
50
51
52
53
54
55
56
57
58
59
60
# 2. 因VictoriaMetrics的UI界面不是太友好,所以部署一个熟悉的Prometheus页面
[root@manager prometheus]# cat proxy-vm.yaml
# vm-promxy.yaml
apiVersion: v1
kind: ConfigMap
metadata:
  name: promxy-config
  namespace: kube-mon
data:
  config.yaml: |
    promxy:
      server_groups:
      - static_configs:
        - targets: [victoria-metrics:8428]  # 指定vm地址,有多个则往后追加即可
        path_prefix: /prometheus  # 配置前缀
---
apiVersion: apps/v1
kind: Deployment
metadata:
  name: promxy
  namespace: kube-mon
spec:
  selector:
    matchLabels:
      app: promxy
  template:
    metadata:
      labels:
        app: promxy
    spec:
      containers:
        - args:
            - "--config=/etc/promxy/config.yaml"
            - "--web.enable-lifecycle"
            - "--log-level=trace"
          env:
            - name: ROLE
              value: "1"
          command:
            - "/bin/promxy"
          image: registry.cn-hangzhou.aliyuncs.com/s-ops/promxy:latest
          imagePullPolicy: IfNotPresent
          name: promxy
          ports:
            - containerPort: 8082
              name: web
          volumeMounts:
            - mountPath: "/etc/promxy/"
              name: promxy-config
              readOnly: true
            - mountPath: /etc/localtime
              name: host-time
              readOnly: true
            - mountPath: /etc/timezone
              name: host-timezone
        - args: # container to reload configs on configmap change
            - "--volume-dir=/etc/promxy"
            - "--webhook-url=http://localhost:8082/-/reload"
          image: registry.us-east-1.aliyuncs.com/y110/configmap-reload:v0.9.0
          name: promxy-server-configmap-reload
          volumeMounts:
            - mountPath: "/etc/promxy/"
              name: promxy-config
              readOnly: true
      volumes:
        - configMap:
            name: promxy-config
          name: promxy-config
        - name: host-time
          hostPath:
            path: /etc/localtime
        - name: host-timezone
          hostPath:
            path: /etc/timezone
---
apiVersion: v1
kind: Service
metadata:
  name: promxy
  namespace: kube-mon
spec:
  type: NodePort
  ports:
    - port: 8082
  selector:
    app: promxy
1
2
3
4
5
6
7
8
9
10
11
12
13
14
15
16
17
18
19
20
21
22
23
24
25
26
27
28
29
30
31
32
33
34
35
36
37
38
39
40
41
42
43
44
45
46
47
48
49
50
51
52
53
54
55
56
57
58
59
60
61
62
63
64
65
66
67
68
69
70
71
72
73
74
75
76
77
78
79
80
81
82
83
84
85
2
3
4
5
6
7
8
9
10
11
12
13
14
15
16
17
18
19
20
21
22
23
24
25
26
27
28
29
30
31
32
33
34
35
36
37
38
39
40
41
42
43
44
45
46
47
48
49
50
51
52
53
54
55
56
57
58
59
60
61
62
63
64
65
66
67
68
69
70
71
72
73
74
75
76
77
78
79
80
81
82
83
84
85
# 3. 安装Prometheus开启HA模式,官网推荐使用VMagent的HA集群模式进行参考 (opens new window),参考2 (opens new window)
[root@manager prometheus]# cat prometheus-deploy.yaml
apiVersion: apps/v1
kind: Deployment
metadata:
  name: prometheus
  namespace: kube-mon
  labels:
    app: prometheus
spec:
  replicas: 2 # 多副本
  selector:
    matchLabels:
      app: prometheus
  template:
    metadata:
      labels:
        app: prometheus
    spec:
      serviceAccountName: prometheus
      containers:
      - image: registry.us-east-1.aliyuncs.com/devops/prometheus:v2.31.1
        name: prometheus
        args:
        - "--config.file=/etc/prometheus/prometheus.yml"
        - "--storage.tsdb.path=/prometheus"  # 指定tsdb数据路径
        - "--storage.tsdb.retention.time=24h"
        - "--web.enable-admin-api"  # 控制对admin HTTP API的访问,其中包括删除时间序列等功能
        - "--web.enable-lifecycle"  # 支持热更新,直接执行localhost:9090/-/reload立即生效
        ports:
        - containerPort: 9090
          name: http
        volumeMounts:
        - mountPath: "/etc/prometheus"
          name: config-volume
        - name: host-time
          mountPath: /etc/localtime
        resources:
          requests:
            cpu: 500m
            memory: 1024Mi
          limits:
            cpu: 2000m
            memory: 4096Mi
      securityContext:
        runAsUser: 0
      volumes:
      - configMap:
          name: prometheus-config
        name: config-volume
      - name: host-time
        hostPath:
          path: /etc/localtime
1
2
3
4
5
6
7
8
9
10
11
12
13
14
15
16
17
18
19
20
21
22
23
24
25
26
27
28
29
30
31
32
33
34
35
36
37
38
39
40
41
42
43
44
45
46
47
48
49
50
51
52
2
3
4
5
6
7
8
9
10
11
12
13
14
15
16
17
18
19
20
21
22
23
24
25
26
27
28
29
30
31
32
33
34
35
36
37
38
39
40
41
42
43
44
45
46
47
48
49
50
51
52
# 4. Prometheus开启远程写入
apiVersion: v1
kind: ConfigMap
metadata:
  name: prometheus-config
  namespace: kube-mon
data:
  prometheus.yml: |
    global:
      scrape_interval: 30s
      scrape_timeout: 15s
      evaluation_interval: 30s
      external_labels: # 根据项目定义labels,在vm中数据源区分
        cluster: 'k8s-local'
    remote_write:    # 远程写入到远程 VM 存储
    - url: http://victoria-metrics:8428/api/v1/write
    rule_files:
      - /etc/prometheus/rules.yml
1
2
3
4
5
6
7
8
9
10
11
12
13
14
15
16
17
2
3
4
5
6
7
8
9
10
11
12
13
14
15
16
17
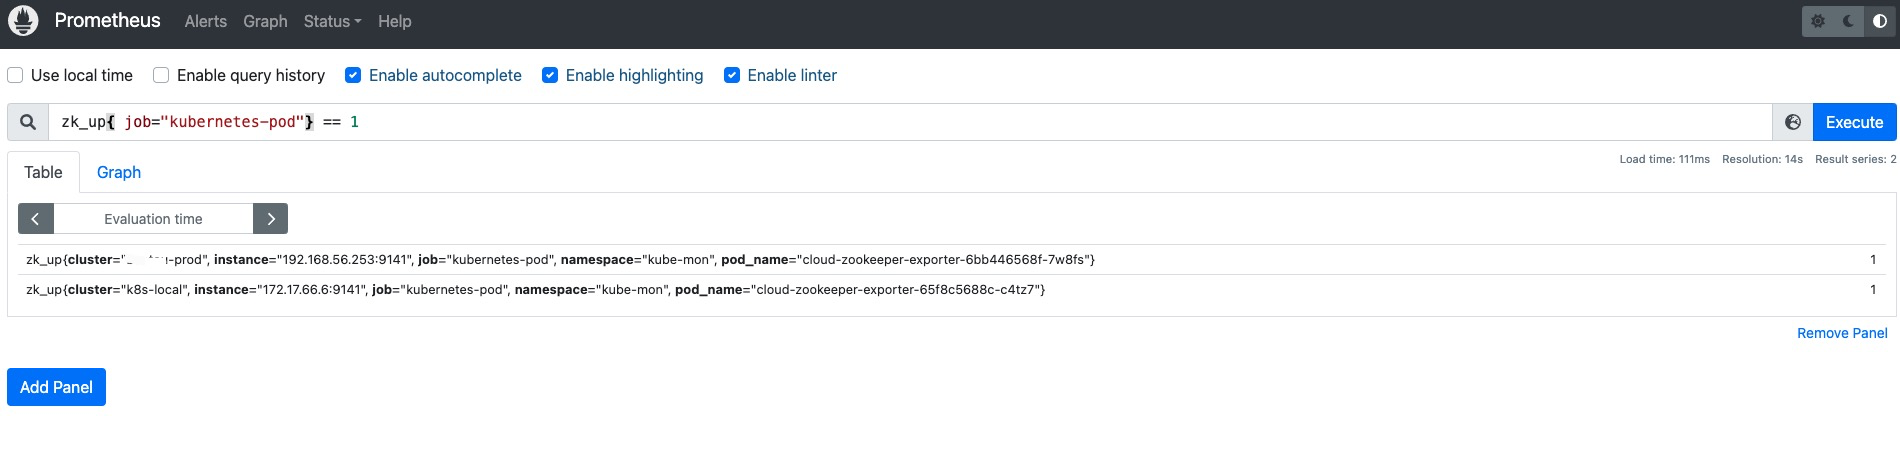
# 5. VictoriaMetrics查询,这边显示2个cluster标签的数据源,因为2个项目的监控数据写入同一个VictoriaMetrics
# 6. HA模式下的Prometheus写入vm,VictoriaMetrics端启用重复数据删除,重复数据删除后可减少磁盘空间使用量,官网 (opens new window)也有明确说明,使用-dedup.minScrapeInterval进行数据去重 (opens new window)
[root@manager prometheus]# cat vm.yaml
apiVersion: apps/v1
kind: Deployment
metadata:
  name: victoria-metrics
  namespace: kube-mon
spec:
  selector:
    matchLabels:
      app: victoria-metrics
  template:
    metadata:
      labels:
        app: victoria-metrics
      annotations:
        prometheus.io/scrape: "true"
        prometheus.io/port: "8428"
    spec:
      volumes:
        - name: storage
          persistentVolumeClaim:
            claimName: victoria-metrics-data
        - name: host-time
          hostPath:
            path: /etc/localtime
      containers:
        - name: vm
          image: registry.cn-hangzhou.aliyuncs.com/s-ops/victoria-metrics:v1.91.3
          imagePullPolicy: IfNotPresent
          args:
            - -storageDataPath=/var/lib/victoria-metrics-data # 数据持久化目录
            - -retentionPeriod=30d # 数据存储时间
            - -maxLabelsPerTimeseries=40 #标签限制数
            - -dedup.minScrapeInterval=30s # 数据去重 建议的值必须等于Prometheus配置中scrape_interval的配置
          ports:
            - containerPort: 8428
              name: http
          volumeMounts:
            - mountPath: /var/lib/victoria-metrics-data
              name: storage
            - name: host-time
              mountPath: /etc/localtime
          resources:
            requests:
              cpu: "500m"
              memory: "1Gi"
            limits:
              cpu: "1000m"
              memory: "2Gi"
1
2
3
4
5
6
7
8
9
10
11
12
13
14
15
16
17
18
19
20
21
22
23
24
25
26
27
28
29
30
31
32
33
34
35
36
37
38
39
40
41
42
43
44
45
46
47
48
49
2
3
4
5
6
7
8
9
10
11
12
13
14
15
16
17
18
19
20
21
22
23
24
25
26
27
28
29
30
31
32
33
34
35
36
37
38
39
40
41
42
43
44
45
46
47
48
49
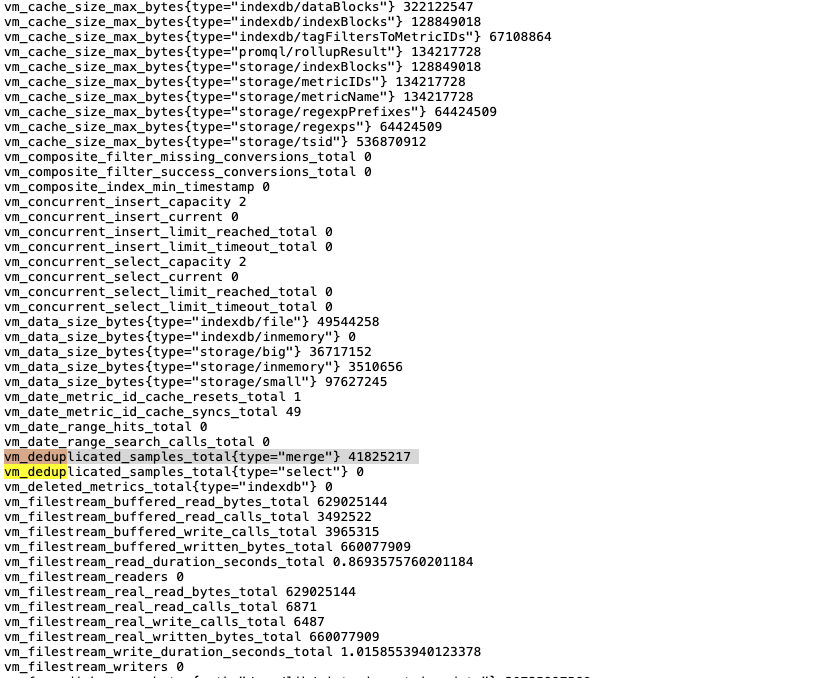
# 7. 查看VictoriaMetrics的metrics指标, vm_deduplicated_samples_total{type="merge"}是VictoriaMetrics 用于记录在数据合并过程中去重的样本数的指标
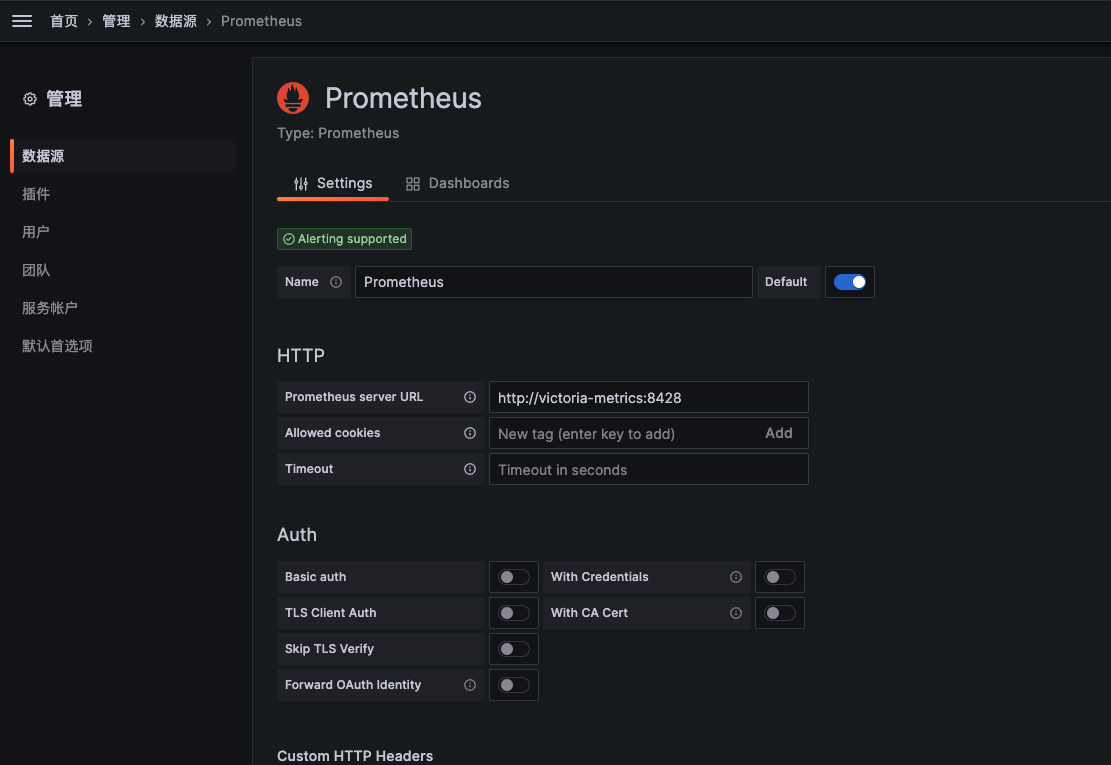
# 8. Grafana配置数据源
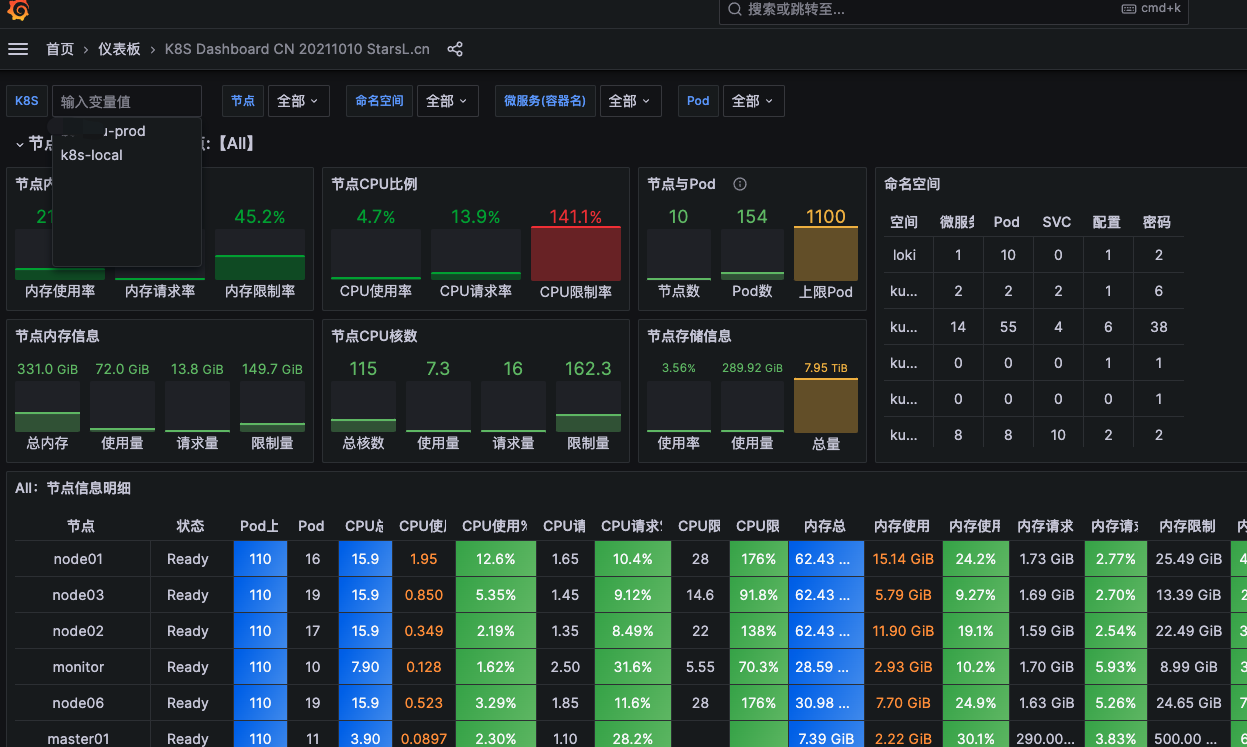
# 8. 导入看板ID,按需更改就可以得到一个Grafana展示多集群
上次更新: 2025/04/25, 03:40:17